Having selected the former option, the Results form appears:

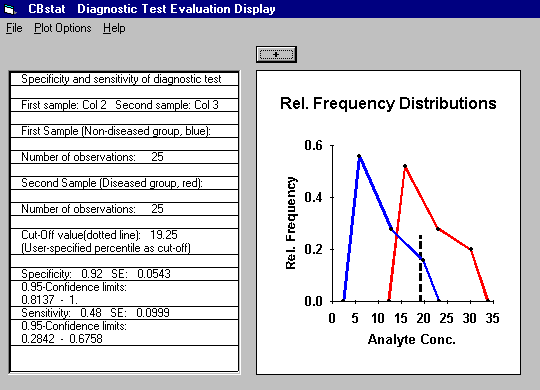
Specificity and Sensitivity with SE for the given cut off point are provided. The plot displays relative frequency distributions for the healthy (blue) and the diseased (red) group.
|
CBstat: A Program for statistical Analysis in Clinical Biochemistry
|
|
Having selected the former option, the Results form appears:
Specificity and Sensitivity with SE for the given cut off point are provided. The plot displays relative frequency distributions for the healthy (blue) and the diseased (red) group. |