CBstat: Diagnostic Test Evaluation and Comparison
Evaluation of a single test:
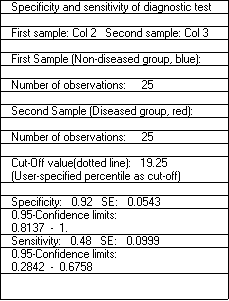
Specificity and sensitivity are estimated corresponding to selected cut-off points, which may be user-specified, corresponding to a given percentile of the distribution of the healthy group, or corresponding to the point that maximizes the sum of specificity and sensitivity.
The ROC-curve is also constructed with display of area with standard error.
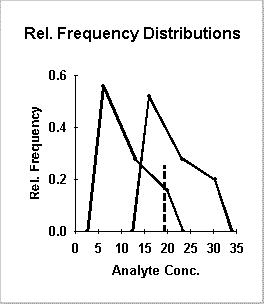
An example of the Results Page produced by the program is shown below. The case corresponds to an evaluation of the demo data example (single test) enclosed in the program.
Specificity/Sensitivity Results Data Display


![]()
Comparison of two tests:
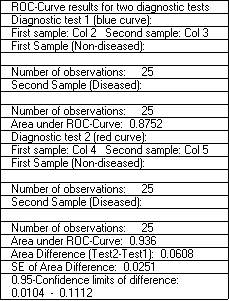
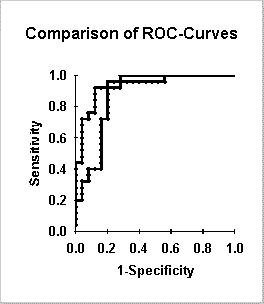
The program compares the performance of two tests by a comparison of the ROC-curve areas. A standard error for a paired comparison forms the basis for a statistical test.
An example of the Results Page produced by the program is shown below. The case corresponds to a comparison of the demo data example (two tests) enclosed in the program.
ROC-Curve Comparison Results ROC-Curves


References:
Linnet K. A review on the methodology for assessing diagnostic tests. Clin Chem 1988; 34: 1379-1386.
Zweig MH, Campbell G. Receiver-Operating Characteristic (ROC) Plots: A fundamental evaluation tool in clinical medicine. Clin Chem 1993; 39: 561-577.