The form with Results and XY Plot appears:
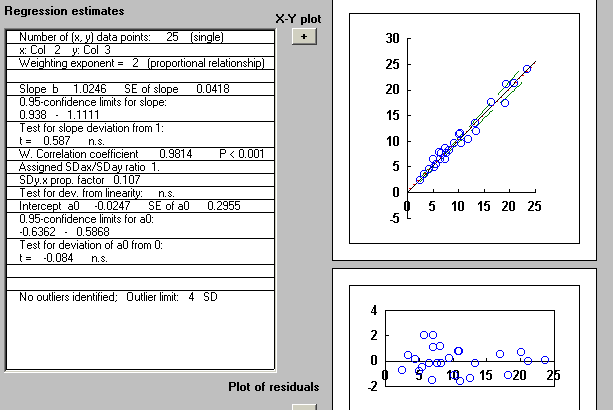
Slope (b) and intercept (a0) with standard errors determined by a modern resampling principle (jackknife method) are shown. Further, t-tests for slope deviation from unity and intercept deviation from zero are displayed. The (weighted) correlation coefficient and a test for linearity are provided. Finally, an outlier evaluation is carried out.
To the right, the XY Plot with 95%-confidence region and a plot of standardized residuals are shown. A homogeneous dispersion of residuals supports the selected model for the given data set.
An outprint of the form with results and plots is obtained by selection in the File drop-down menu.
Separate full page outprints of plots are also available. In the Plot Options menu, the scale etc. may be modified in the plots.
Similar Results and XY Plot displays are provided for OLR, WLR, and Deming Regression Analysis.